Make and audit
Build from scratch or on an existing codebase, then audit the result against the rules.
Sprezzature is a set of skills for Claude Code or OpenCode. Install the ones you want, then ask in plain language. The skill both makes the artifact and audits it.
Grab the latest release, copy the skills you want into your runtime.
VERSION=1.0.0    # latest tag on the releases page
curl -L https://github.com/warith-harchaoui/sprezzature/releases/download/v${VERSION}/sprezzature-skills-${VERSION}.tar.gz | tar xz

mkdir -p ~/.claude/skills          # OpenCode: ~/.opencode/skills
cp -r sprezzature-ui sprezzature-figures ~/.claude/skills/
Just want one tool, no agent? Each deterministic tool also ships as a standalone pip package. See Packages.
Trigger phrases route the request; the skill makes it, then audits it against the rules.
Full install options (checksums, OpenCode + local Ollama, upgrades) →
Each skill's scripts also ship as a standalone pip-installable package. Use them in your own pipelines, without the agent layer.
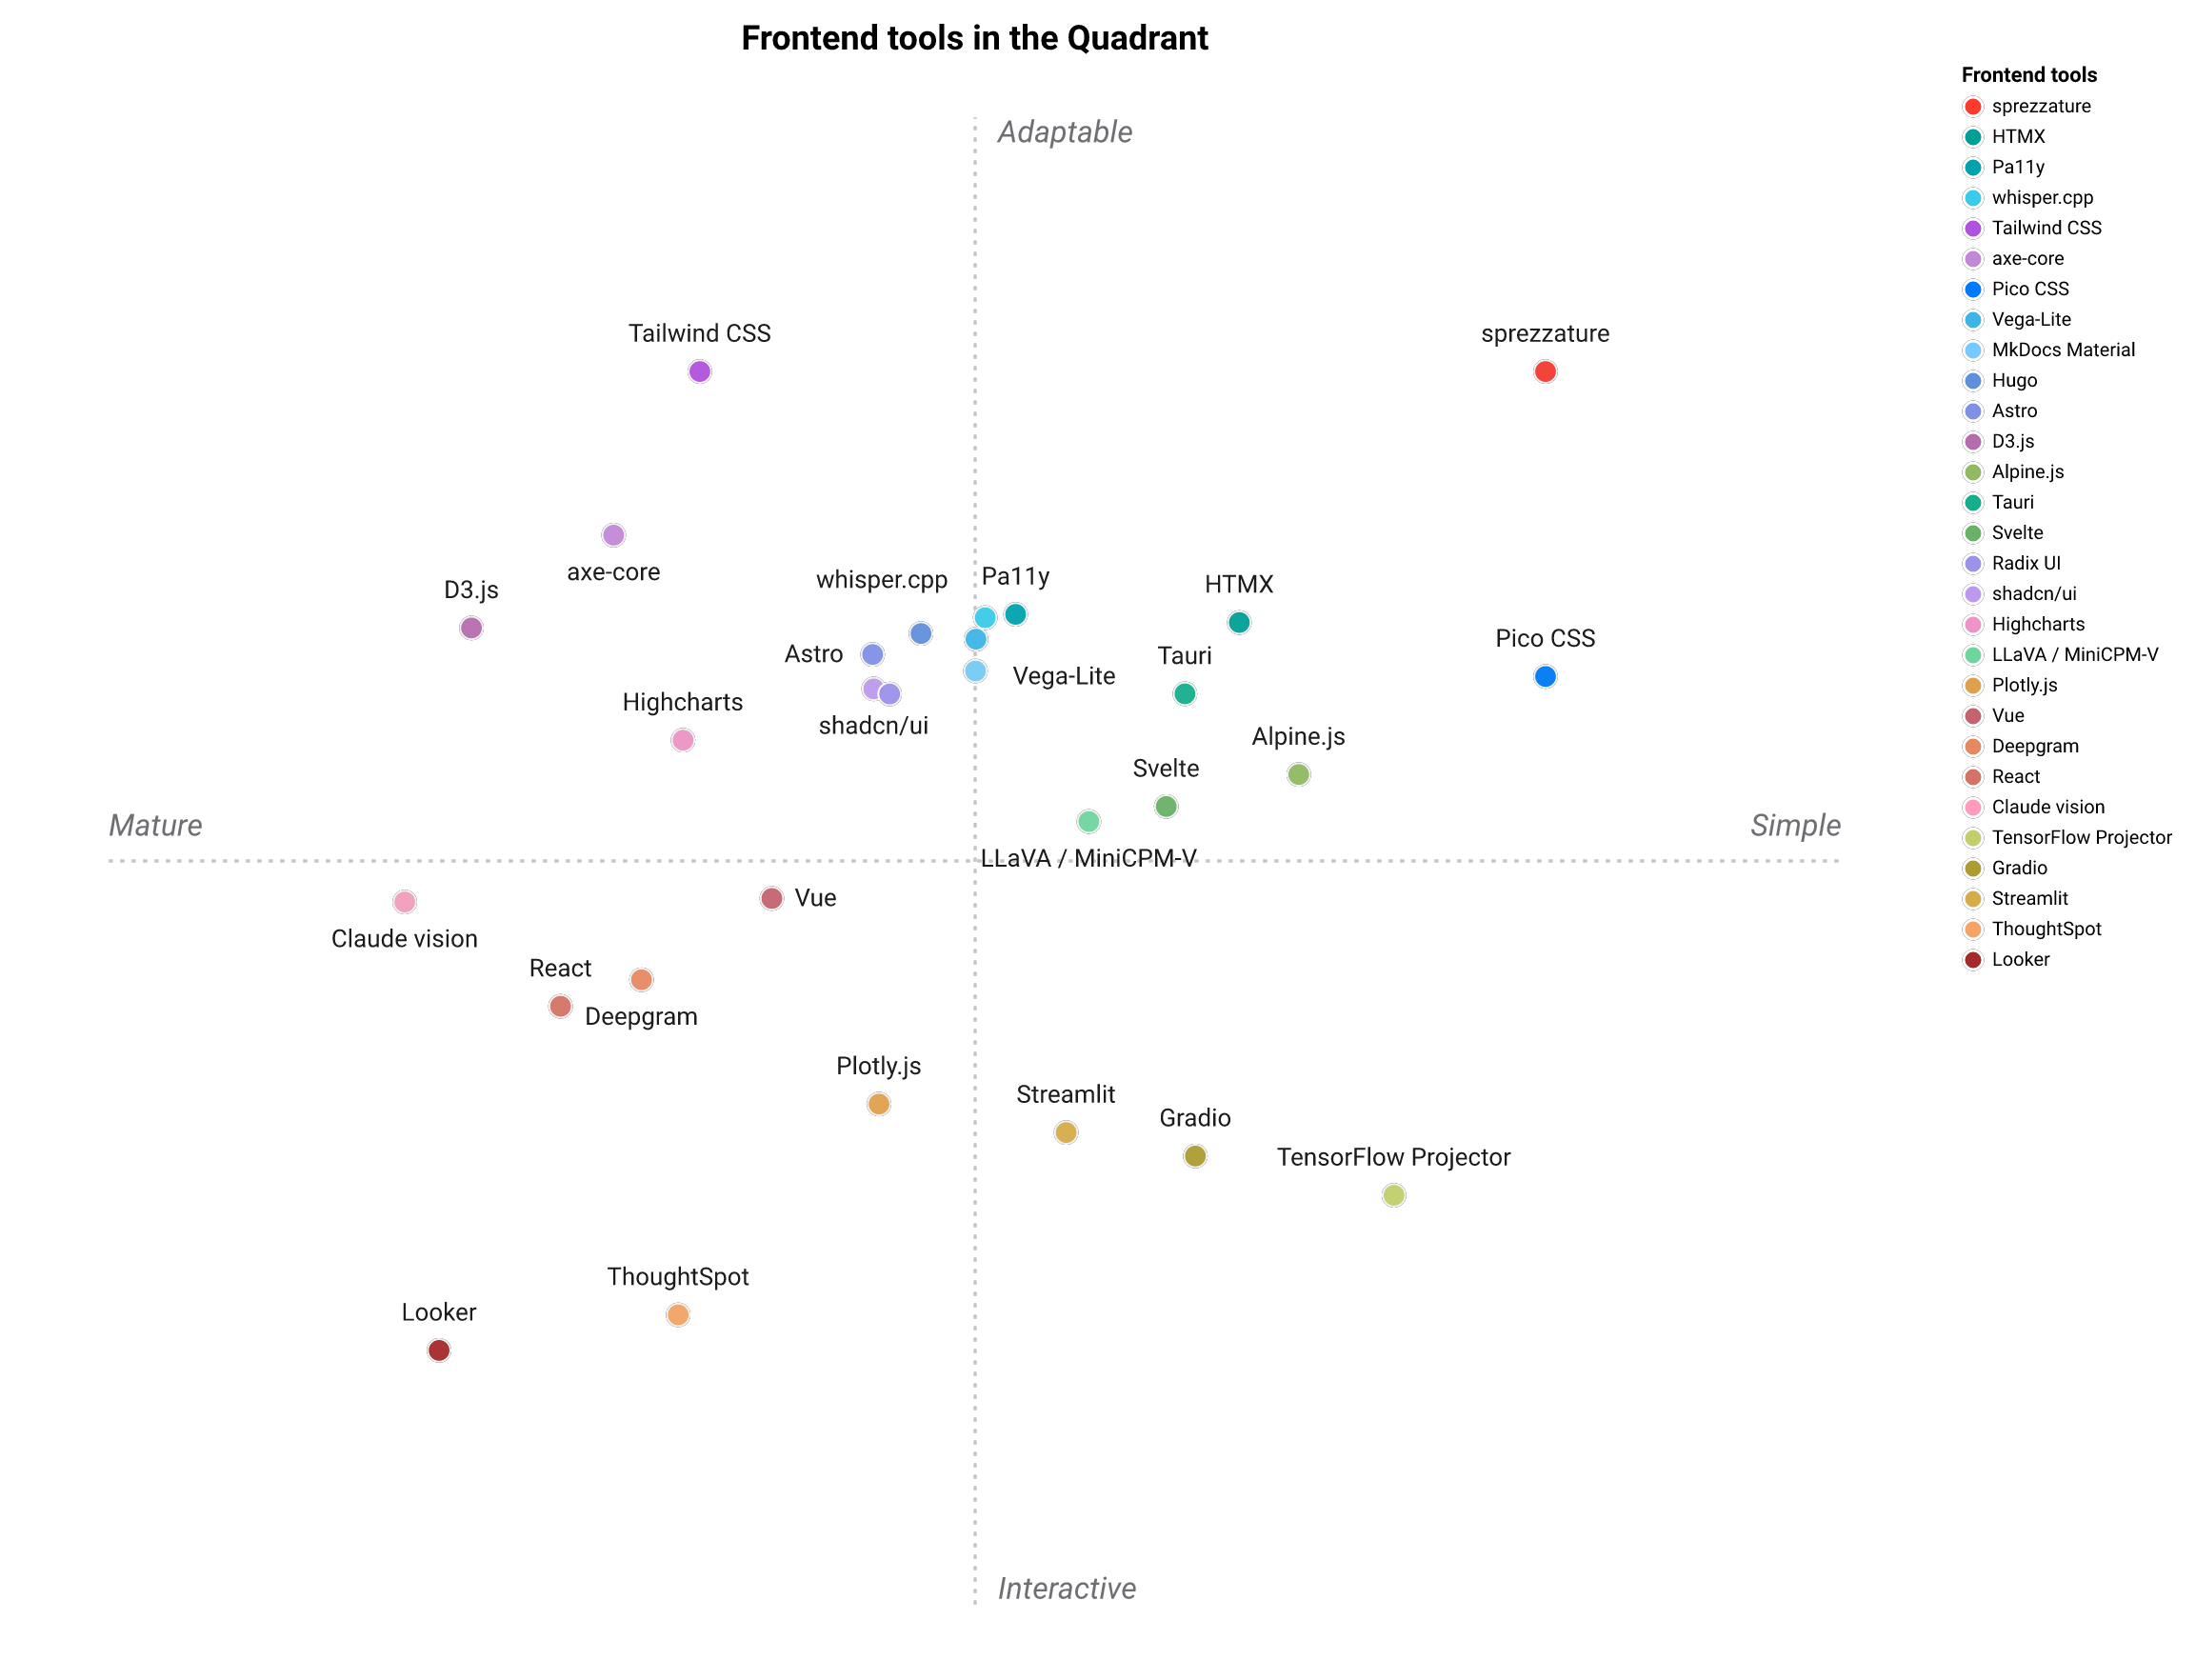
A few frames from sprezzature-figures: our house style and images made with care, on a fitting palette. The full catalog of charts and statistical plots has its own page.
Build from scratch or on an existing codebase, then audit the result against the rules.
The text, audio and vision models could run locally if you ask for it; nothing has to leave the machine.
Skills cover accessibility, colors, typography, languages, search-engine optimization (SEO), and generative-engine optimization (GEO).
Skills serve Claude Code and OpenCode.
You can proofread a sentence by reading it back. You can't do that with a chart: whether it's right lives in the pixels, not the code. So the Ralph Eyeball Loop takes whatever you made (a Vega chart, a TikZ figure, a Mermaid diagram, a whole web page) and renders it to an image with a deterministic tool, no model involved. Then something actually looks at it: by default the agent itself, the same one that wrote the code, or, fully offline, an optional local vision model. It catches what a code check never will: a label cut off at the edge, a legend that slid off the canvas, two nodes sitting on top of each other, colors that vanish for a colorblind reader. Fix the source, render again, look again. It's a prescribed review loop, not an autonomous critic. Everyone else aims this at web pages. We aim it at charts and diagrams too.
A figure ships as carefully written scalable vector graphics
(SVG). The generators emit the markup directly, each with a matching viewBox, so the graphic scales to any size without a blurry pixel and the
text stays selectable. Vega-Lite is one handy way to describe a chart, but the Vega JavaScript
Object Notation (JSON) is not what you ship, and the Portable Network Graphics (PNG) is only an export for
places that can't take vector art. The SVG is the deliverable.
Special thanks to Audrey Dejoux, Laurent Pantanacce, Auguste Baum, Julien Boyer and Jérôme Gombert for fruitful discussions.
Color palettes from harchaoui.org/warith/colors.
The three Roboto families are bundled under the SIL Open Font License.
We also drew on the Human Interface Guidelines, Google Material Design and Laws of UX.